Electrum Console
The Electrum Console is a portal that allows Electrum’s clients to monitor the health and performance of their Electrum services. Some services also allow for clients to manage and configure these services themselves.
Each client has their own dedicated Console environment(s) covering the full range of their Electrum Payments OR DGS (VAS) services. All Payments services for one client are grouped in a Console environment. All DGS services for one client are grouped in one Console environment.
Electrum Console Access and Permissions
Electrum will provide you with a URL for your Console during the onboarding process. The URL will be portal.payments.(your institution name) for Payments services or portal.dgs.(your institution name) for DGS services. Navigate to the relevant URL if you wish to access the Console.
Users will require login credentials to access the environment. Electrum will have enabled your institution’s email domain during onboarding. Anyone with an email address that falls under this domain will be able to sign up using their email address. These users will have default viewing permissions, for example, will be able to view transactions and message flows.
If you require different permissions, e.g., the ability to access the Finance tab, or to edit mappings in the Configuration sections, then log a ticket with Electrum. Electrum will manually update your user profile with the required permissions.
For general support queries and investigations, you should only need the default viewing permissions. This will allow you to see details of any transaction and to find out where and what errors have occurred.
View Transactions
The Transactions tab of the Electrum Console allows users to view the list of transactions or investigate individual transactions that have been processed by Electrum.
Find and View a Transaction
If you wish to investigate a specific transaction (for example, one that is failing), then do the following:
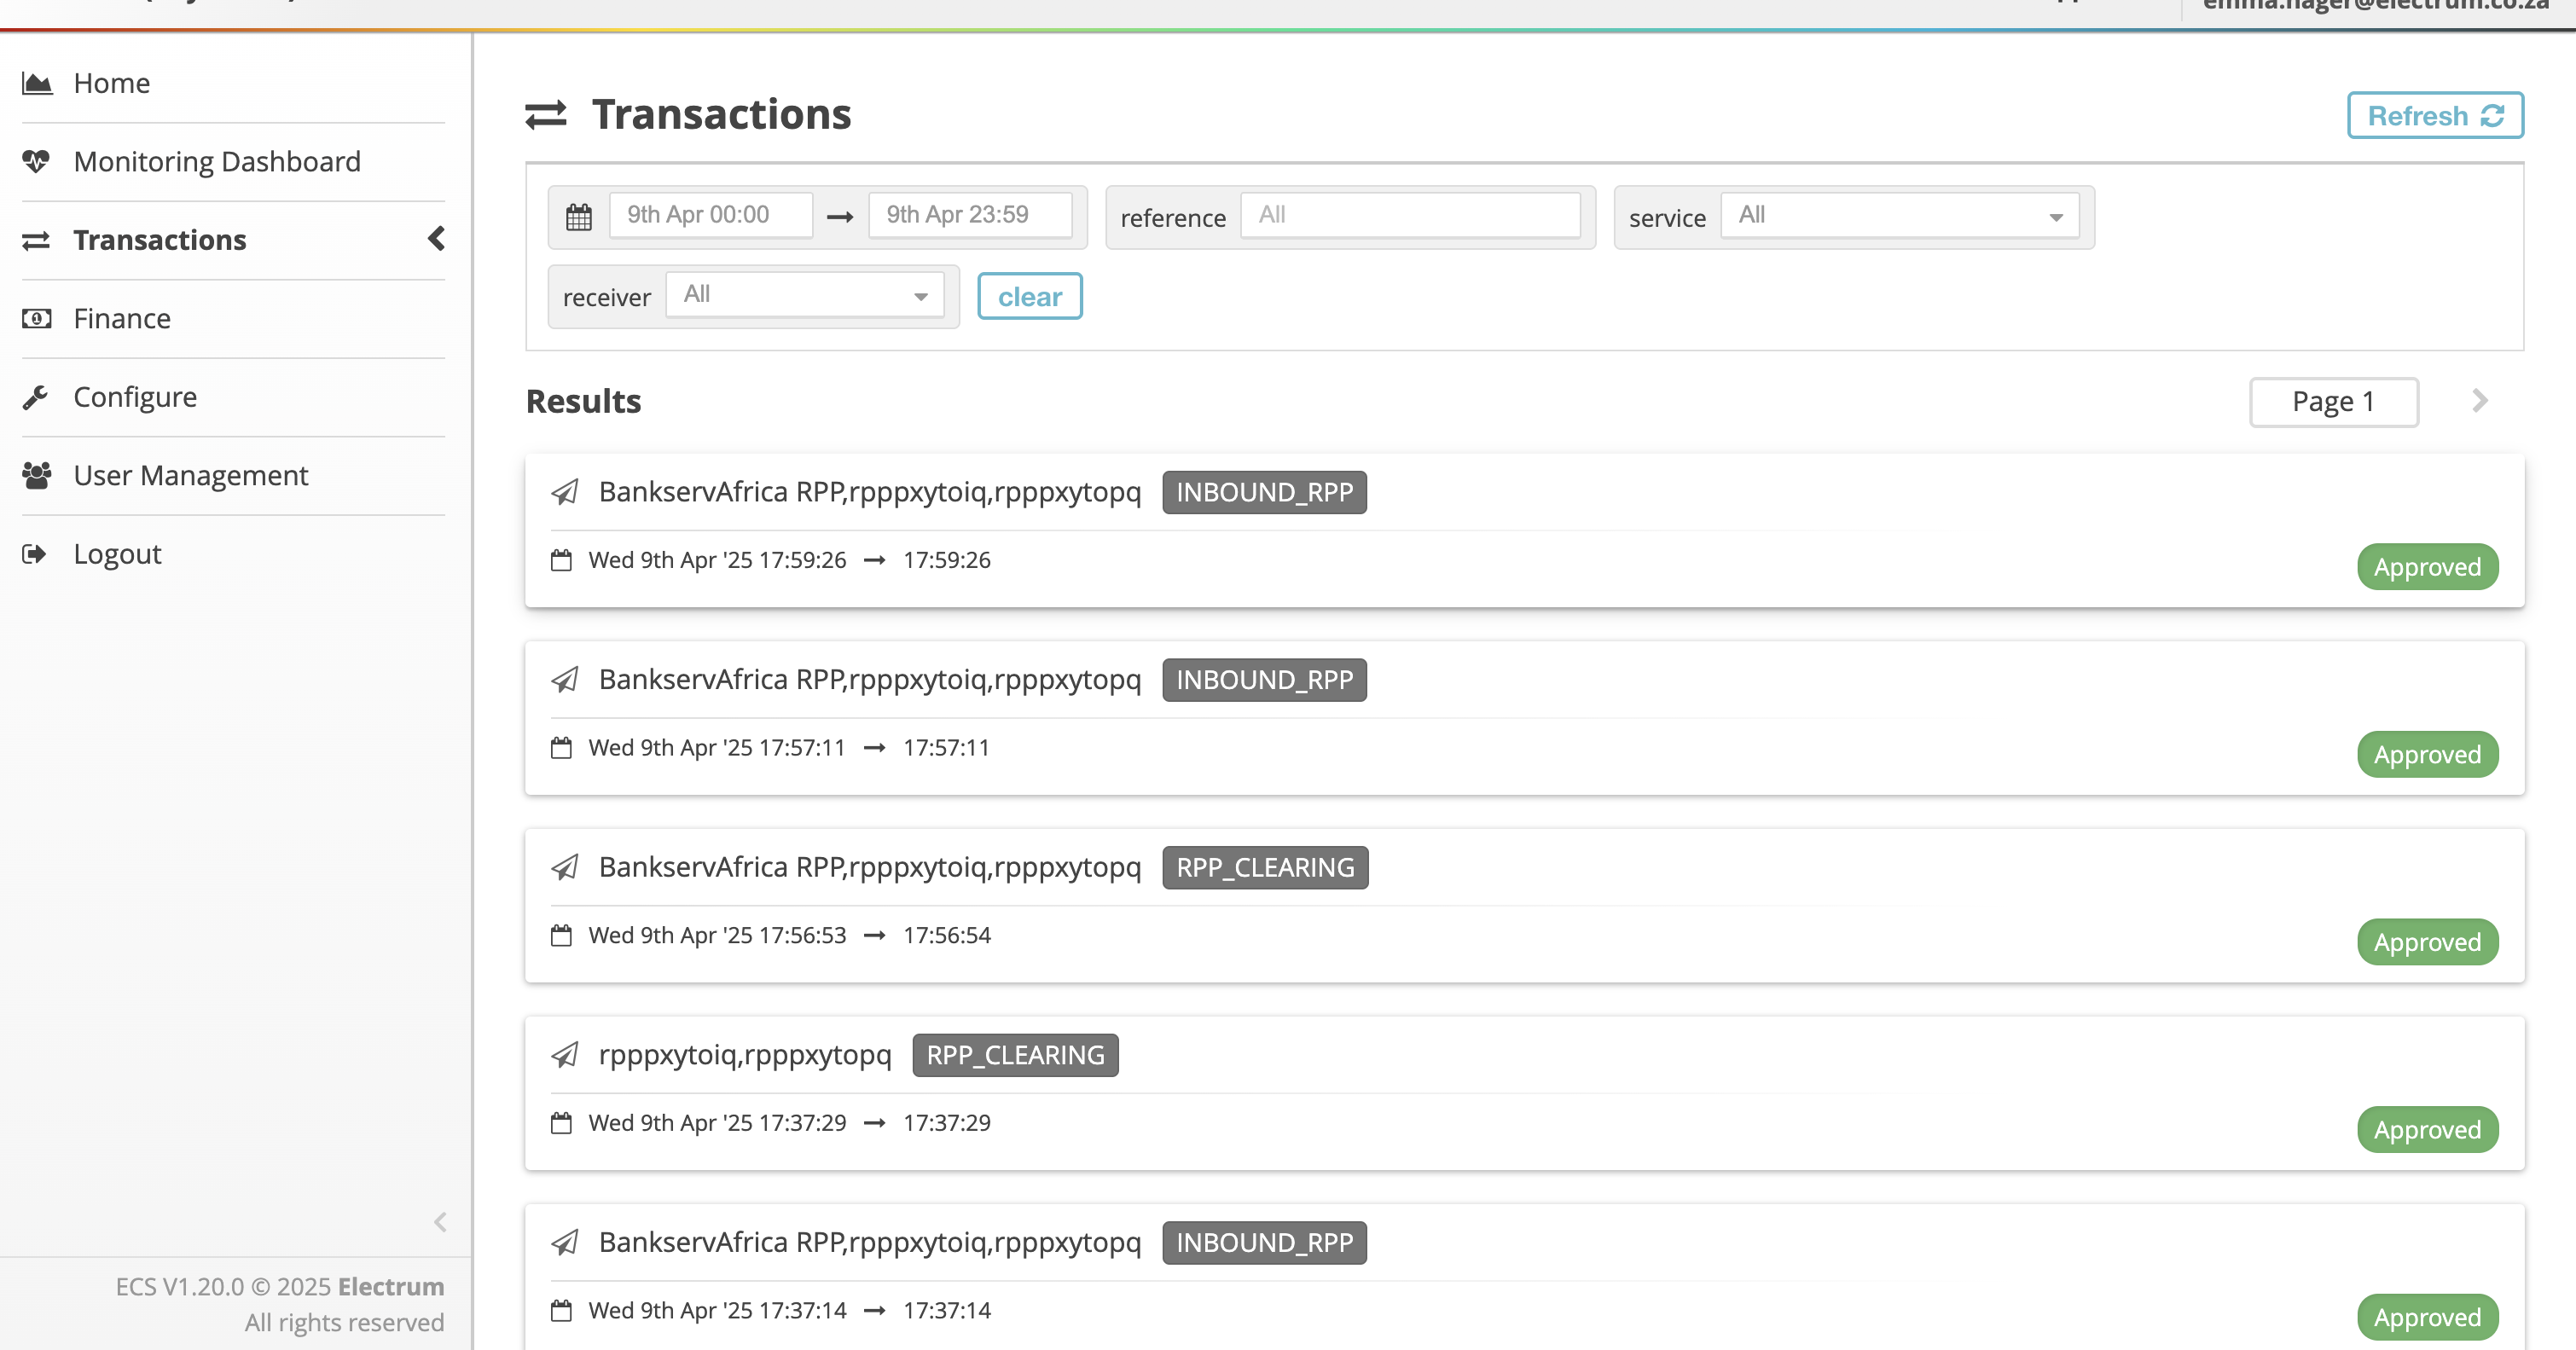
- In the left-hand menu of the Console, click Transactions. The default page view shows a list of all transactions for the current day across all services.
- Search for a specific transaction by entering the message ID or trace ID in the reference field. Alternatively, filter the list of transactions by entering at least one of the following criteria (note that this will likely return a number of transactions that fall under the criteria).
- The date and time range when the transaction was received by or sent to Electrum.
- The service from the available drop-down menu - this refers to the broader service under which the transaction falls. For example, Airtime, RPP Clearing.
- The receiver from the available drop-down menu. This is the entity that ultimately receives a request message. For VAS services, the receiver would usually refer to the service provider or aggregator of the VAS. For Payments services, the receiver could refer to the client bank (you), BankservAfrica, or one of your internal core banking systems - any system or institution that can receive a request message during a transaction flow.
The actual content of the service and receiver drop-down list may vary from client to client. The items listed may differ based on the engineering team who has implemented the service and how they have labeled the items. There is therefore no set list.
For example one client may have ‘RPP Clearing’ listed in the service drop-down menu, while another may simply have ‘RPP’ for the same service.
Contact Electrum if you are unsure about any items in the drop-down list.
- The transaction(s) will be displayed as a list of cards under the Results section. Each card shows the reference, date and time, transaction type (e.g., RPP_CLEARING), and outcome for that specific transaction.
Click on the tile to expand the transaction in question. A yellow box, containing more information about the transaction, will appear.
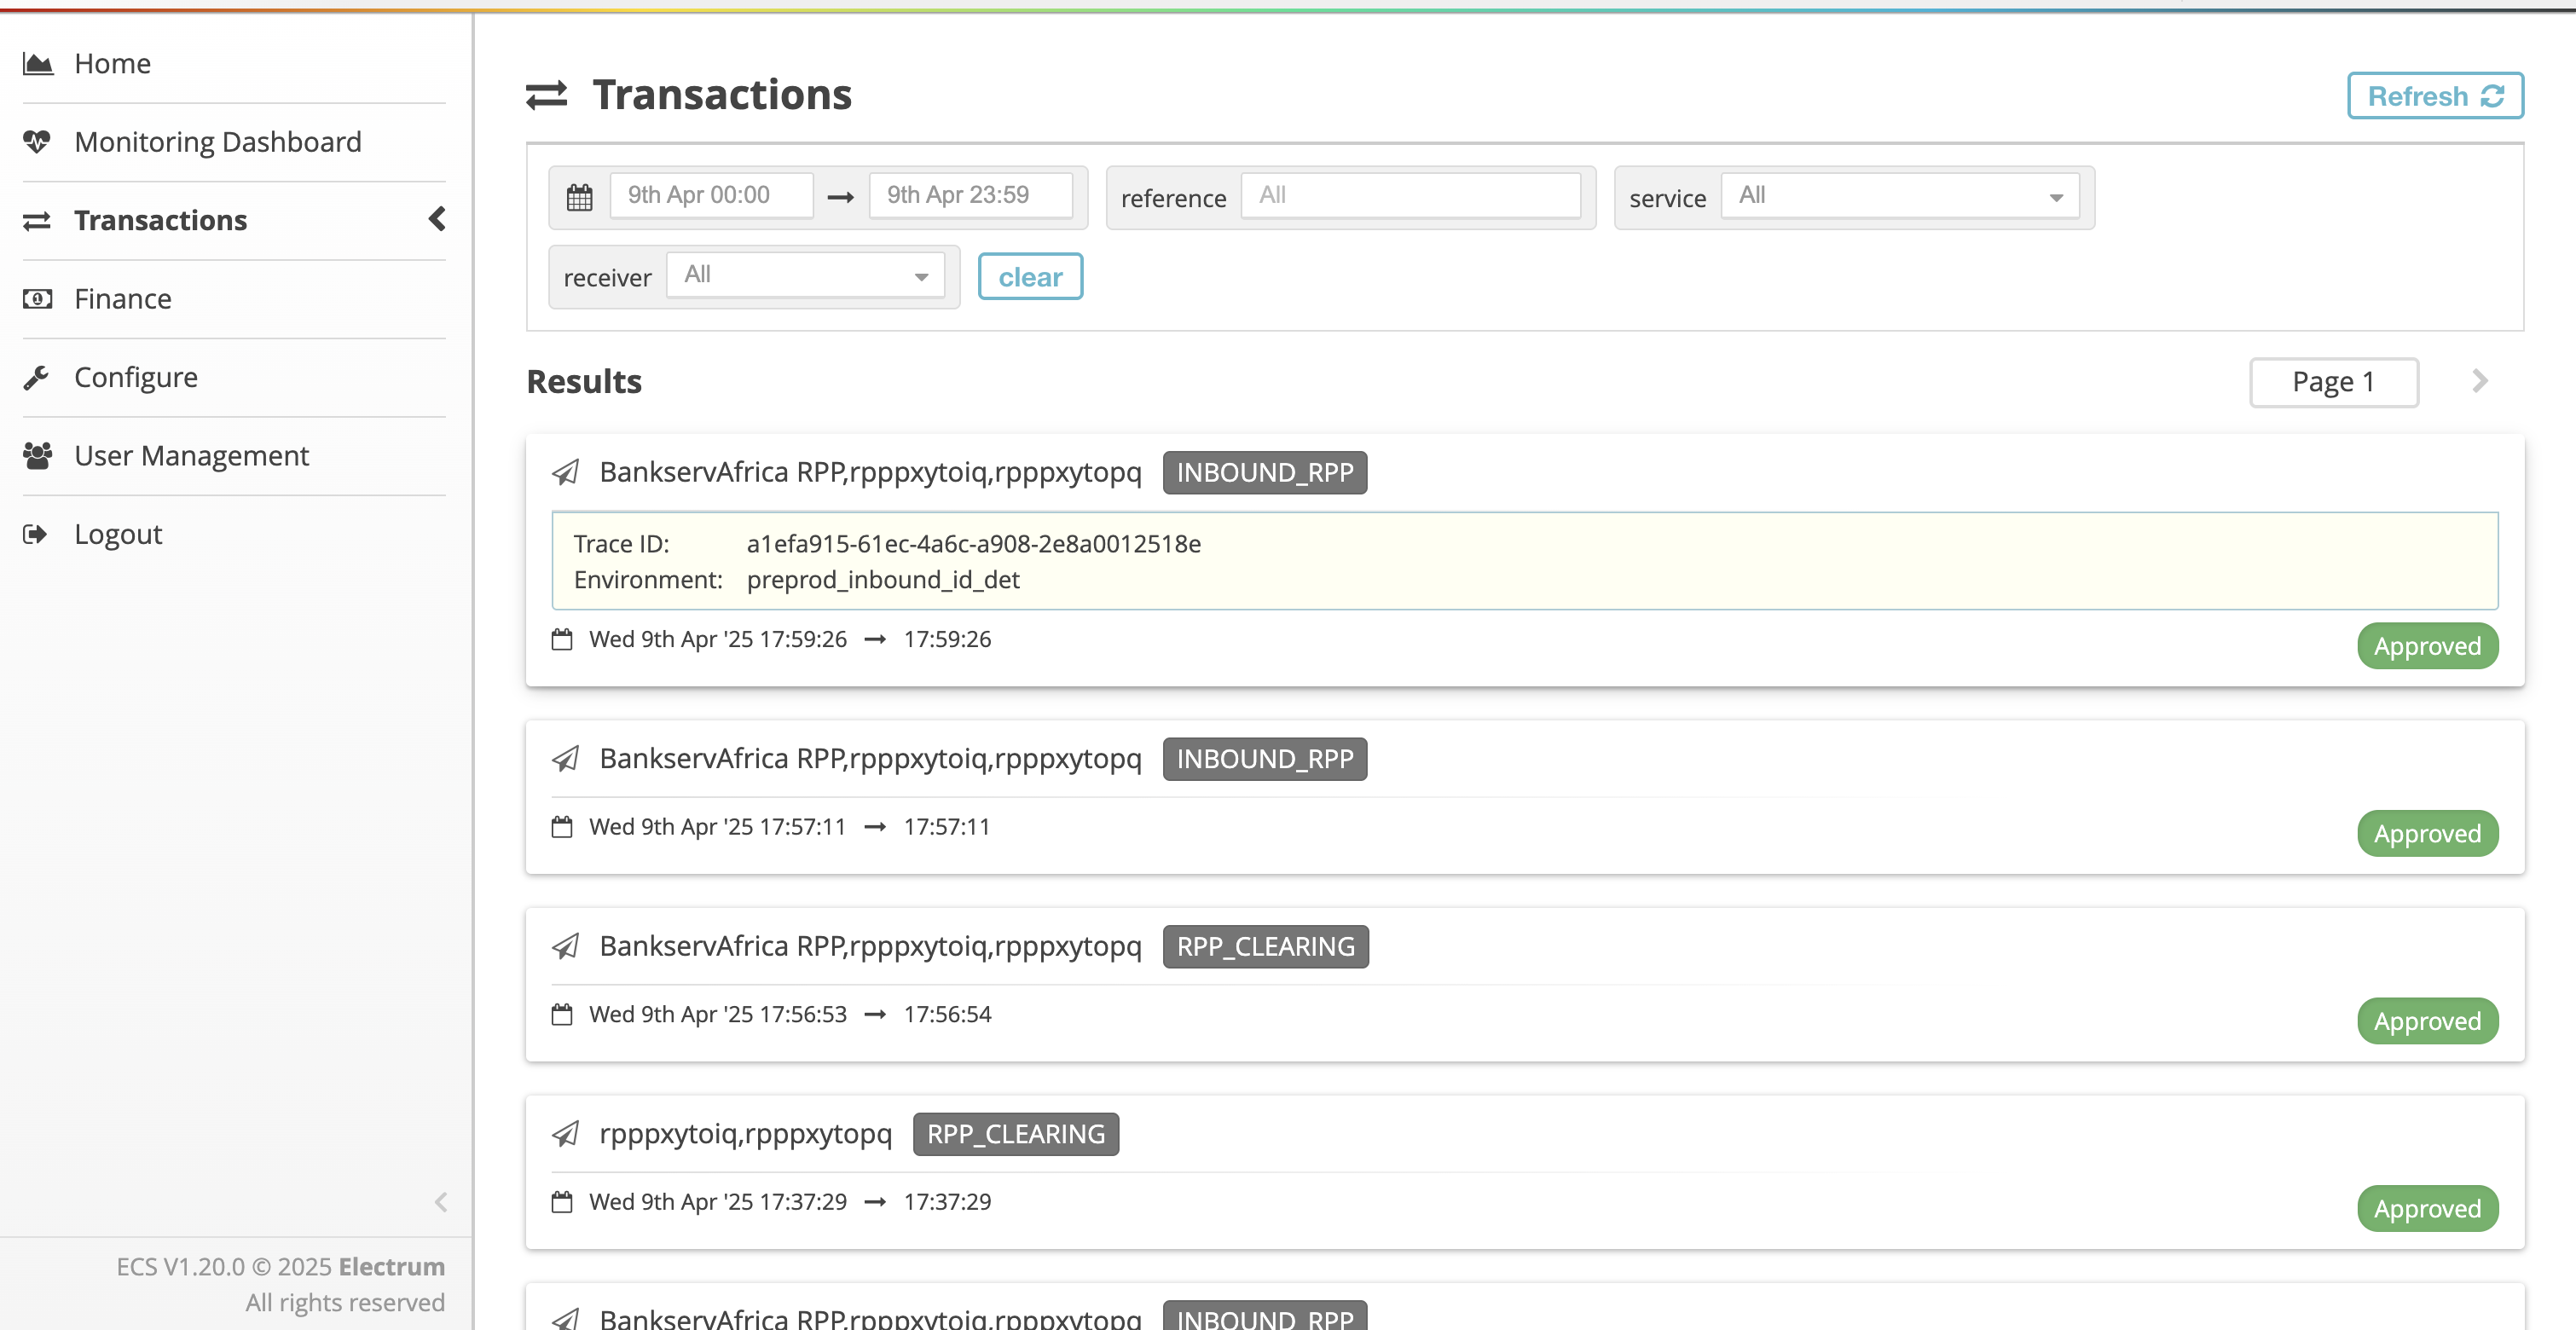
- Click on the yellow box. You will now see a view of the transaction message flow and associated message traces. It will look something like this:

Note that this is a simple example. Many full message flows are longer and more detailed than this.
Interpret the Message Flow Diagram
Interpret the message flow diagram as described below.
The central (elongated cylindrical) box represents Electrum systems as a whole (i.e., any instance of the Electrum switch that performs transaction processing).
External boxes represent upstream or downstream entities integrated with Electrum (e.g., BankservAfrica and banks). The boxes are labeled with the relevant entity. The boxes labelled with your bank name may refer to your channels (e.g., banking app) or to your core banking components that interact with Electrum’s systems.
The arrows represent the message flow (i.e., to Electrum from an external entity, or from Electrum to an external entity.
The same entity can be depicted on either side of Electrum at different parts of the flow.
- When an entity sends a technical request message (e.g., a payment or purchase request) to another, then the arrow flows from left to right. As Electrum is always depicted by the centre block, an entity sending a message to Electrum will always be shown on the left side of the diagram at that point. If Electrum is sending a message to another entity, then the entity will be shown on the right hand side at that point.
- A second arrow flowing from right to left immediately below the first can represent:
- A technical response (HTTP ACK or NACK) in the case of asynchronous messaging.
- A functional response to a synchronous request, then a second arrow representing this second message will flow from right to left, back to the entity.
The overall message sequence reads from top to bottom.
Consider the diagram above. As it is a bank involved you could assume that a payment is involved. We also know that most payment processing is asynchronous. You could interpret the diagram like this:
- The bank initiates an outbound payment by sending a request message to Electrum (arrow flows from left to right, so bank is shown on the left as Electrum is always in the middle). Electrum returns a technical response to the bank.
- Electrum then forwards the payment request to BankservAfrica (arrow flows from left to right for an unsolicited request, so bank is shown on the right as Electrum is always in the middle). BankservAfrica returns a technical response to Electrum.
- Once BankservAfrica has processed the payment with the industry on its side it sends a message to Electrum with the outcome of the payment. Note that although this message could be thought of as a response to the initial payment request, it is in itself a completely new message and is sent as a technical request. Therefore the arrow flows from left to right, so this time BankservAfrica must be depicted on the left side of the diagram. Electrums sends a technical response to BankservAfrica.
- Electrum forwards the payment outcome message to the bank, which is now shown on the right side of the diagram. The bank returns a technical response to Electrum.
How to Use the Flow Diagram for Investigations
Select an individual message. The trace of that message will appear below the flow diagram.
You can examine the trace to see the message details and outcome, and to see where errors have occurred. Click the Copy Trace button to copy the trace details to the clipboard. This is useful if you need to save or share raw message details for troubleshooting purposes.
For a more detailed example, see the Outbound PayShap Success section.