Monitoring and Alerts
Kibana is a 3rd-party tool that provides visualisations of the large amounts of data provided by an application's log output. It is primarily used by operational support teams to monitor the health of a system.
Monitoring Dashboards
Electrum provides a standard set of Kibana dashboards to the operational support teams of the originating systems connecting into Electrum services. These are described below.
Message Overview Dashboard
The Message Overview dashboard shows all messages that have been processed by the Electrum Switch, including all messages transmitted between the Electrum Switch and all integration partners being serviced.
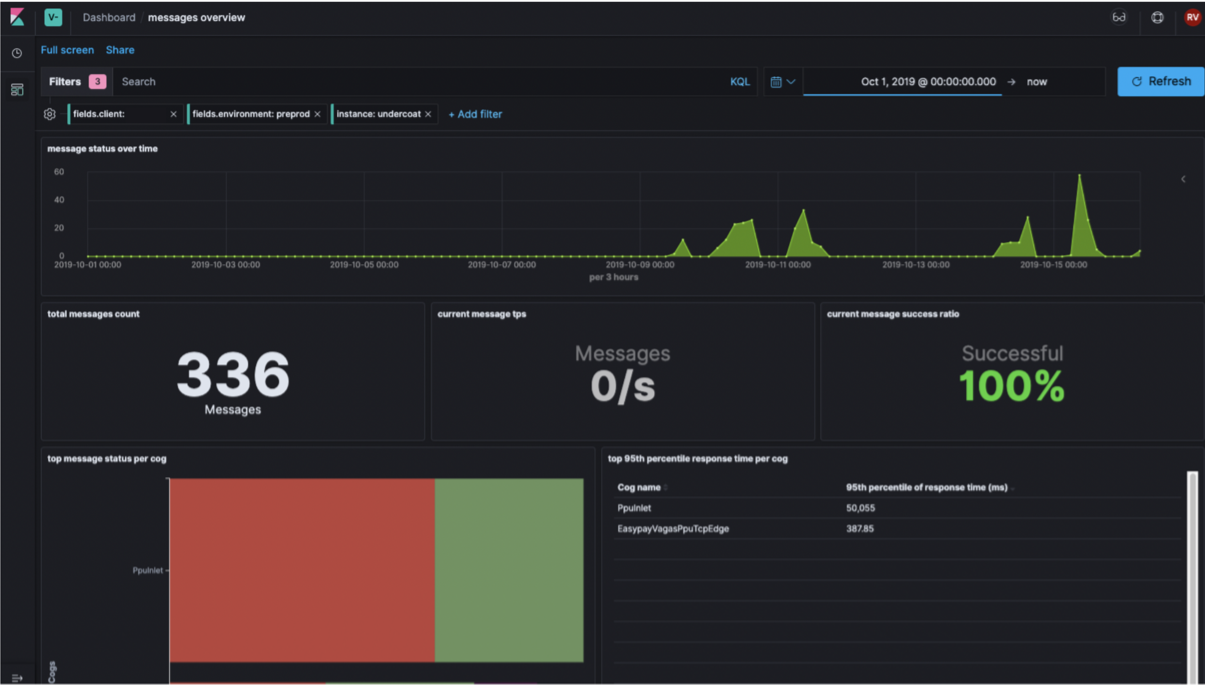
The Messages Overview dashboard allows an operator to specify a date and time range for which to see the following statistics:
- A time series of message volumes.
- A total count of messages processed over that period.
- The current rate at which messages are being processed in transactions-per-second (TPS).
- The percentage of messages processed successfully.
This message statistics includes all individual request, response, reversal, confirmation and other types of messages processed by Electrum.
A message is considered to be successful if it does not include any error response code. Hence, if a consumer’s transaction is declined by a destination system, say, because the consumer is attempting to redeem an expired token, then the response message from the destination system to the Electrum Switch, as well as the response message from the Electrum Switch to the originating system, will be considered as unsuccessful, even though no processing failure has occurred.
Message Cog Detail Dashboard
The Message Cog Detail dashboard allows operators to troubleshoot messages on a deeper level by displaying details of transaction processing by "cogs" within the Electrum Switch.
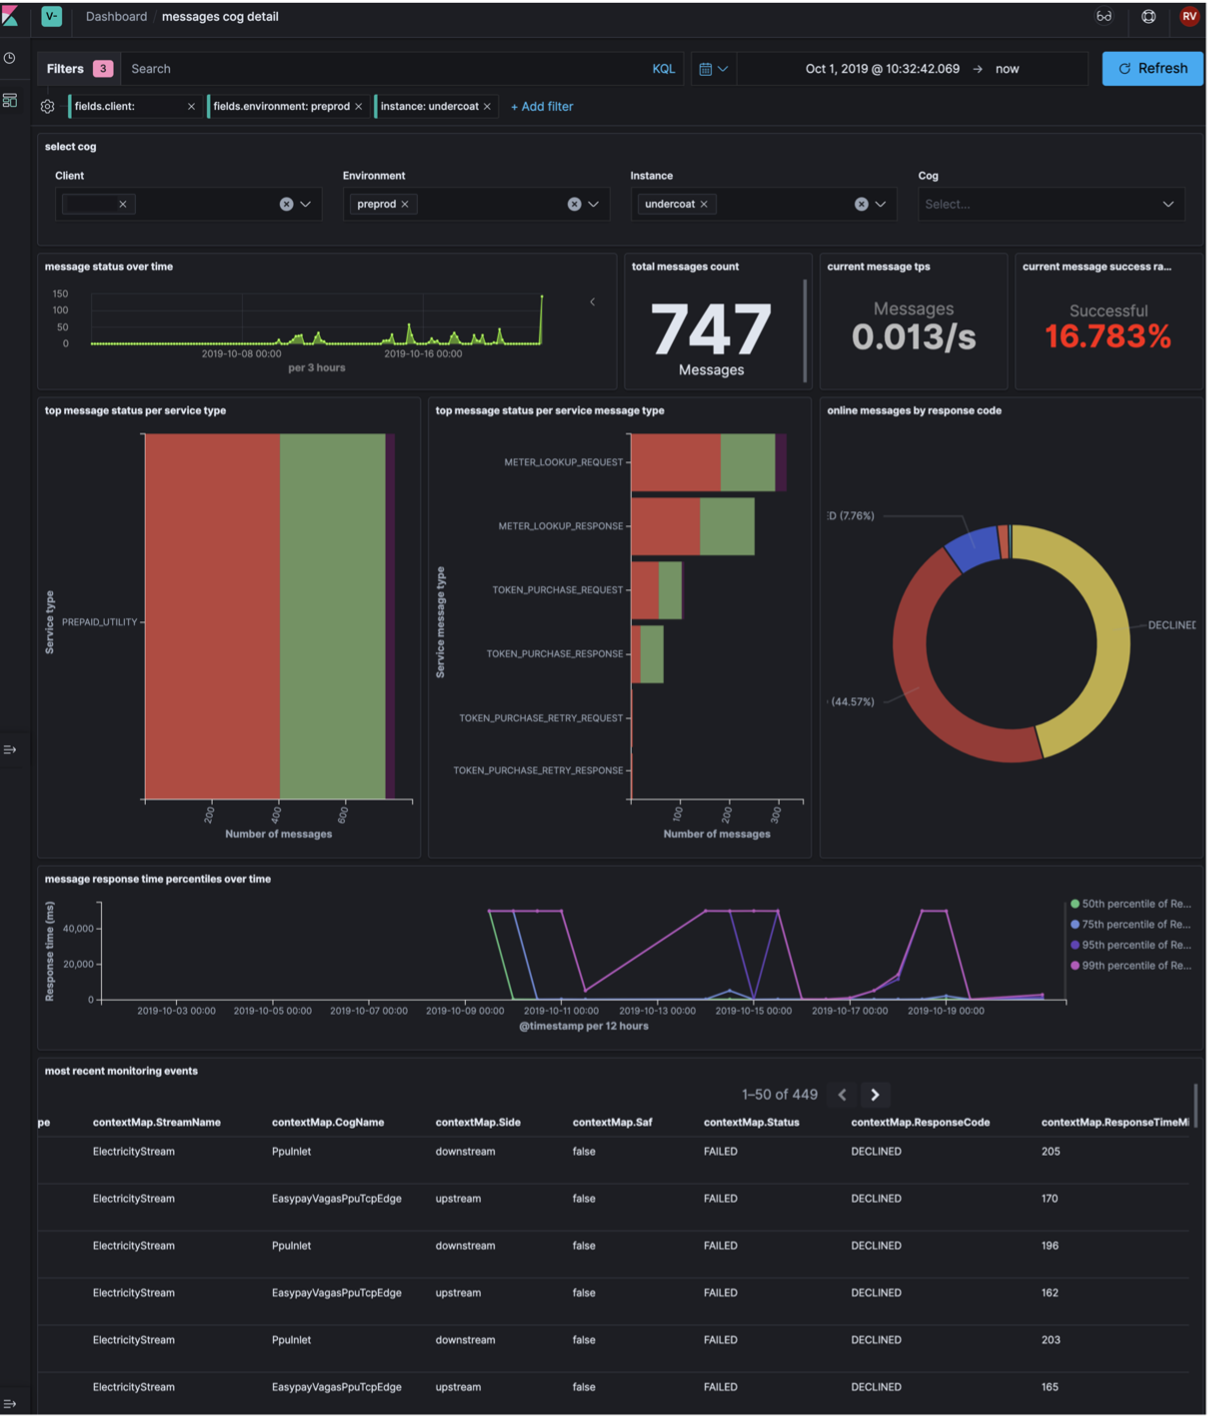
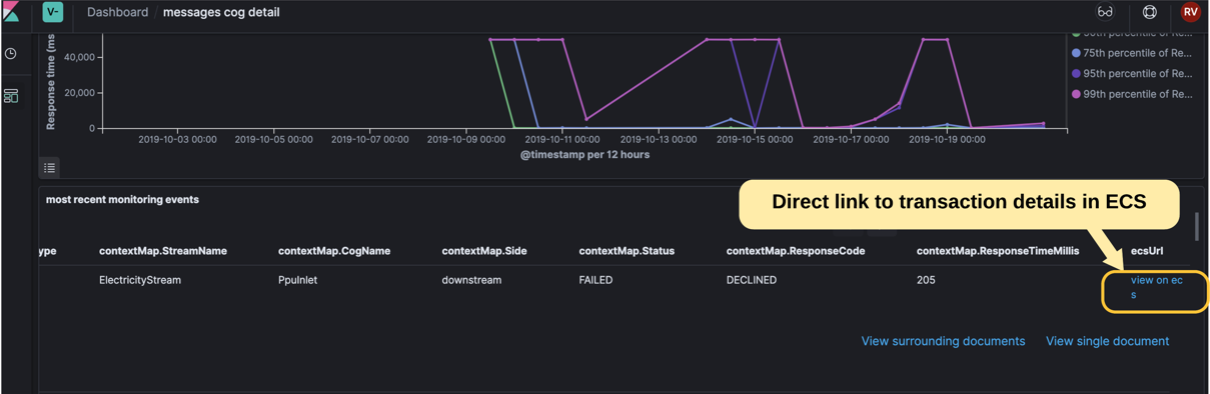
This dashboard shows event details which operators are able to expand for further investigation. Within each event’s expanded details, a button is available with a direct link to the particular transaction’s details in the Electrum Console.
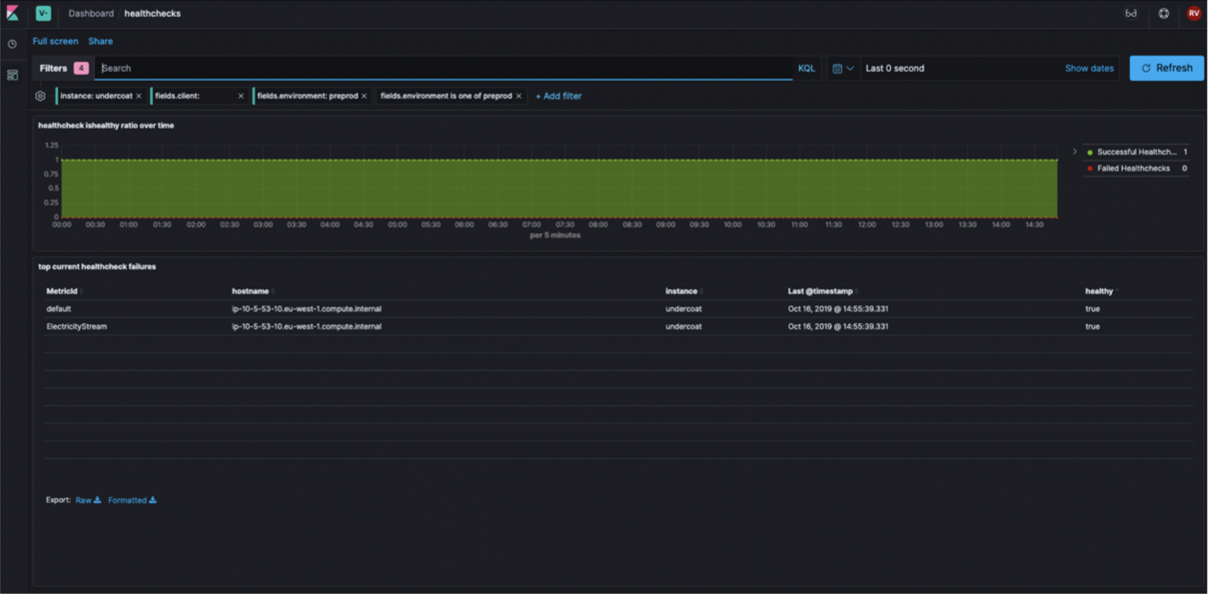
Healthcheck Dashboard
The Healthcheck dashboard displays an overview of whether all connections and services are running or not.
Switch SAF queue dashboard
The Switch SAF Queues dashboard includes information about Electrum’s SAF queues through which advice messages are transmitted to destination systems.
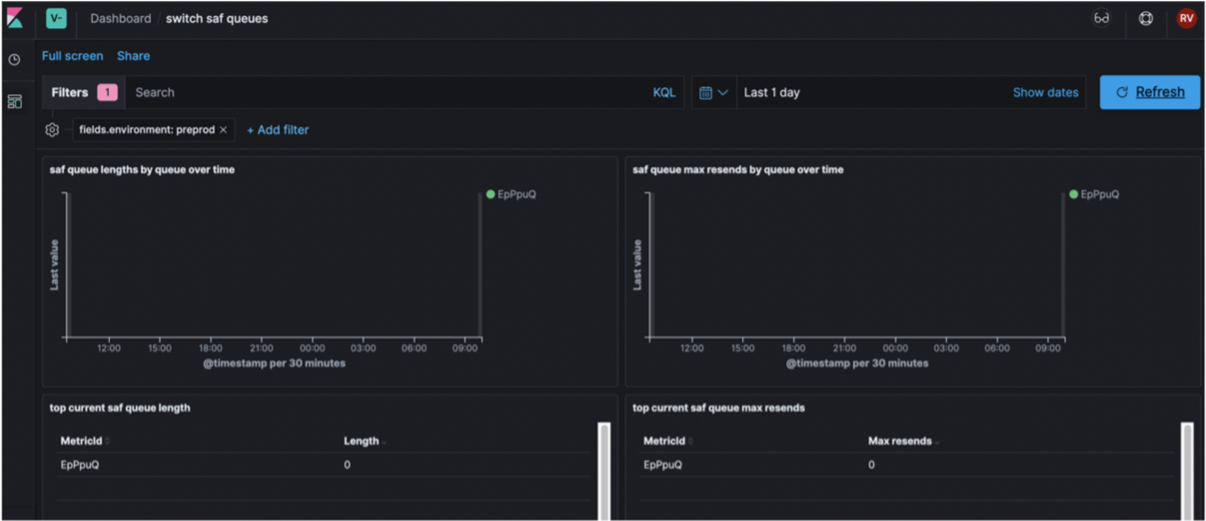
This dashboard shows two metrics over a selected time range, namely, the length of SAF queues in the system, and the maximum number of times that transactions have been resubmitted through the SAF queues.
Four basic alert triggers are configured by default to ensure that if any problem is found in the production environment it is resolved as soon as possible. The alerts are delivered via email to any number of supplied addresses.
The alert triggers are as follows:
- Disconnect - Triggers when the Electrum Switch disconnects from the service provider. This alert can only be configured where the connection is persistent and not on-demand.
- Store-and-forward length - Triggers when there is a store-and-forward queue buildup. This could be caused by either a failed transaction is blocking the queue, or a service provider failing to respond to requests from the Electrum Switch. The alert gives an indication of the number of transactions delayed by the queue.
- Store-and-forward retry - Triggers when the transaction at the head of the store-and-forward queue has not being responded to after a certain number of retries. This indicates the length of time a transaction has been blocking the queue.
- Transaction failure - Triggers based on thresholds that are configured. The transaction counts will be valid during a sliding window period (10 minutes by default). For example, 20 out of the last 100 transaction (20%) failed/declined within the last 10 minutes. These events normally provide an indication that there is an issue with the service provider.